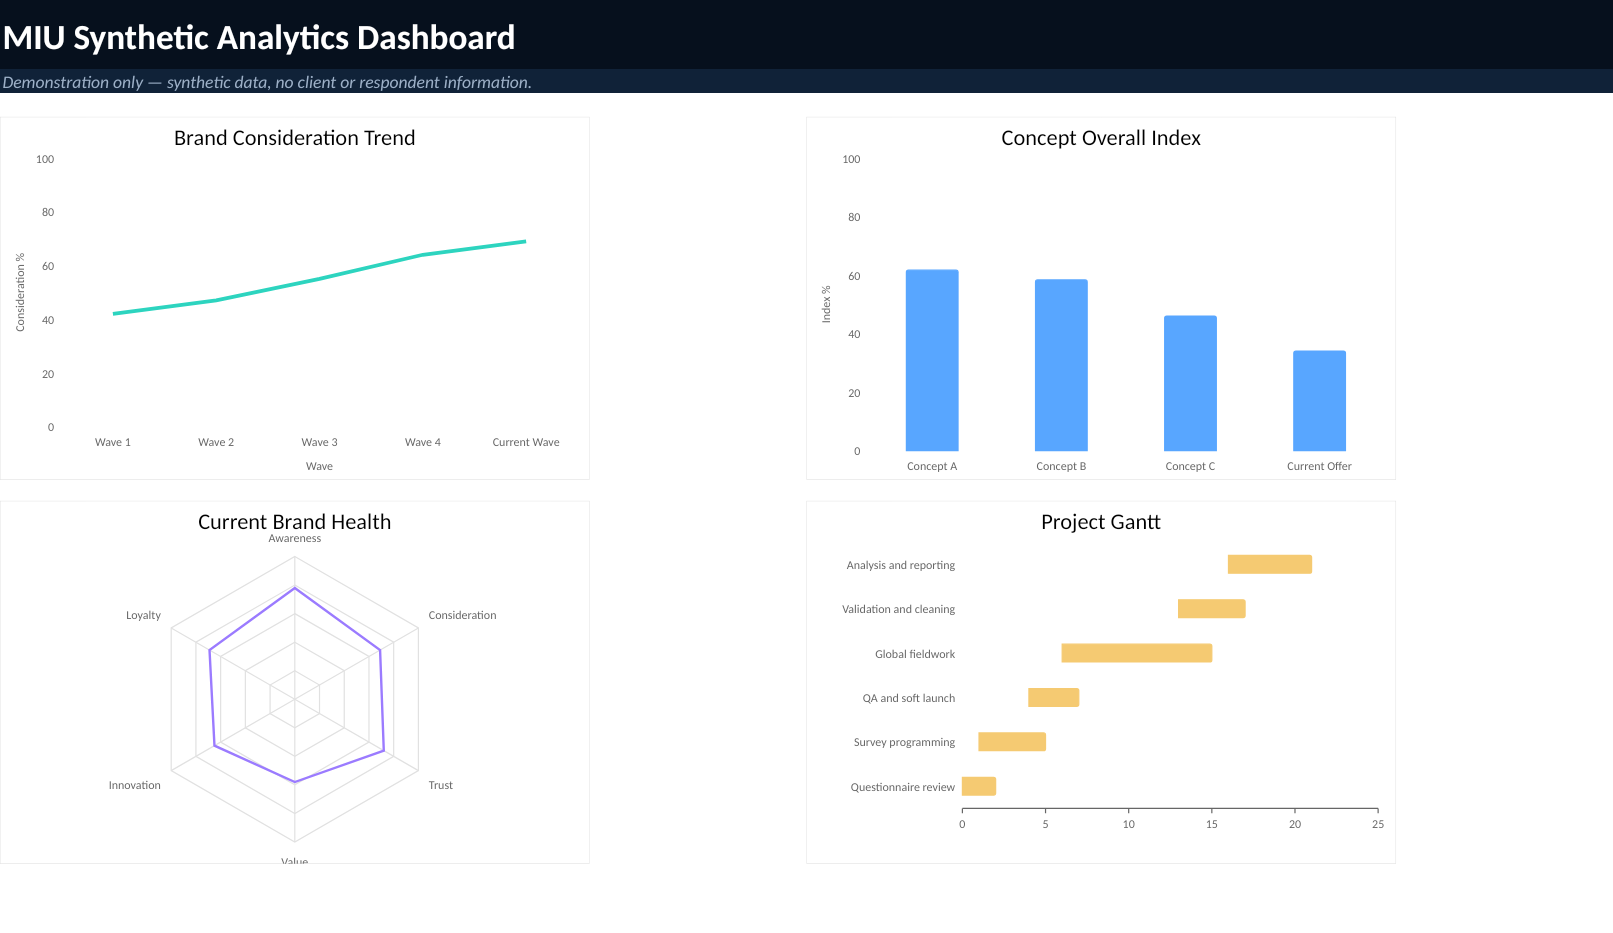
Concept preference bar chart
Example comparison of concept appeal scores.
The public portfolio uses synthetic data to demonstrate charting, Gantt planning, brand tracking, concept testing and downloadable analysis files. It does not claim a specific client engagement.
All values are illustrative and intended only to show presentation quality and analytical structure.
Example comparison of concept appeal scores.
Example comparison between current and previous tracker waves.
Example multi-workstream schedule from review to reporting.
Example wave trend against a synthetic benchmark.
Challenge: coordinate survey programming, quota monitoring and reporting across several markets.
MIU-style support: central project plan, partner briefing, soft launch, validation, crosstabs and executive output.
Challenge: recruit verified professional audiences with complex roles and low incidence.
MIU-style support: feasibility, source strategy, screening, validation, analysis and caveat-led reporting.
Challenge: assess suspicious patterns after fieldwork.
MIU-style support: duplicate, speed, pattern and open-end review with flagged and cleaned outputs.
Challenge: provide leadership-ready findings quickly.
MIU-style support: data preparation, key cuts, charts, topline narrative and dashboard-ready file.
These files can be replaced with approved anonymised examples later.